In this tutorial you will learn how to use interface an LED Bar with an Arduino. If you are looking for a good status indicator, LED bars are an excellent option.
LED bars are a group of independent LEDs arranged next to each other. They come in a variety of colors, and LED counts.
In this article, I will take you through a step-by-step connection guide, examples of Arduino projects, LED bar basics, and some hints to make the best out of your LED bar projects.
You may find the applications of LED bars in weighing scales, decorations, music festivals, audio spectrum displays, etc.
They stand out well in outdoor environments, making them a preferred choice for many applications.
Let’s get started!
Components Needed To Build Arduino And LED Bar Graph Project
Hardware Components
- Arduino Uno Rev3 x 1
- LED Bar Graph x 1
- Dupont wire
- Arduino USB cable (for powering Arduino and programming) x 1
- Breadboard x 1
- BergStick Connectors (optional)
Software
Makerguides.com is a participant in the Amazon Services LLC Associates Program, an affiliate advertising program designed to provide a means for sites to earn advertising fees by advertising and linking to products on Amazon.com.
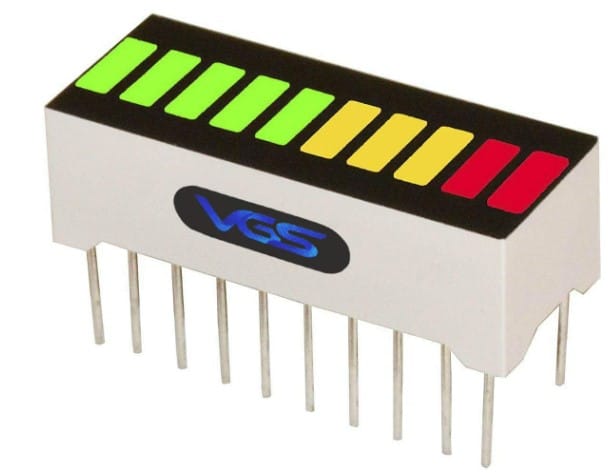
What Is An LED Bar Graph? How does LED Bar Graph Work?
Let us look at one of the LED light bar graphs from Everlight.
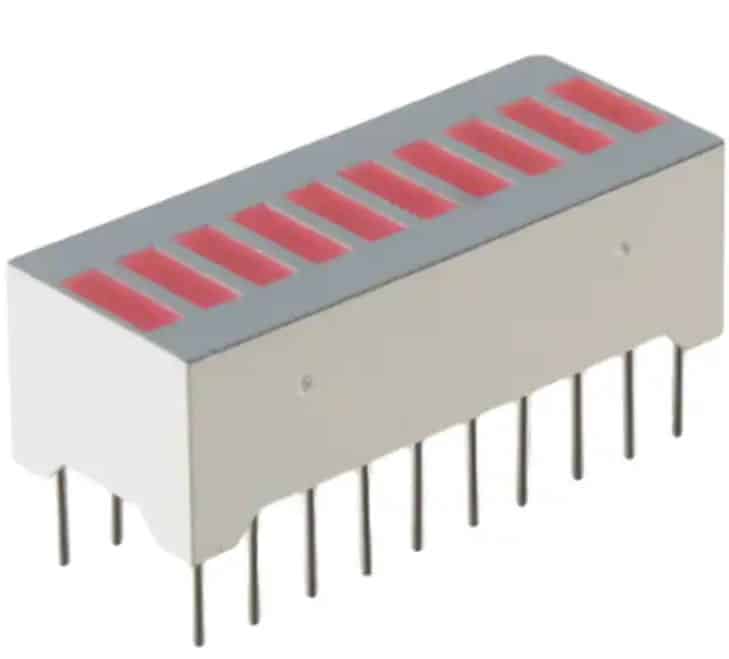
The LED bar graph above has ten independent red LEDs. You can access the anode and cathode of each LED separately. Hence it has 20 pins.
The figure below shows the typical driver circuit one uses to drive the bar graph. You don’t have to use the driver mandatorily.
If you don’t use the driver IC, you need 10 GPIO pins of the Arduino to control the 10 LEDs in the bar graph.
If your design limits the number of available inputs, you can choose a driver IC dedicated to driving such LED bar graphs. You will find various options while choosing the dedicated IC.
You can communicate with the driver IC over serial protocol ( 2wires) or even use a DAC signal to control the analog input of the driver IC.
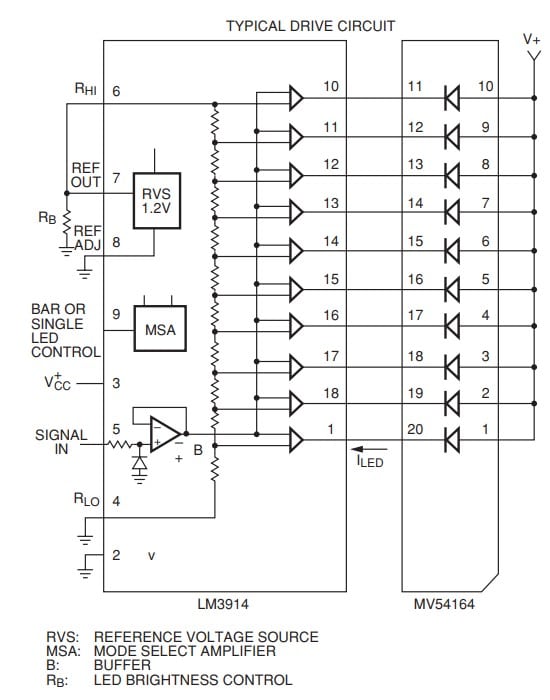
There are also LED bar graph modules with built-in controllers. As a designer, you must decide on cost versus GPIO pins.
A dedicated driver must be used when driving several such LED bar graphs.
Some LED bar graphs are mono-color, and some will be multi-color.
Multi colors are more informative in terms of status indication.
They are also my personal favorite.
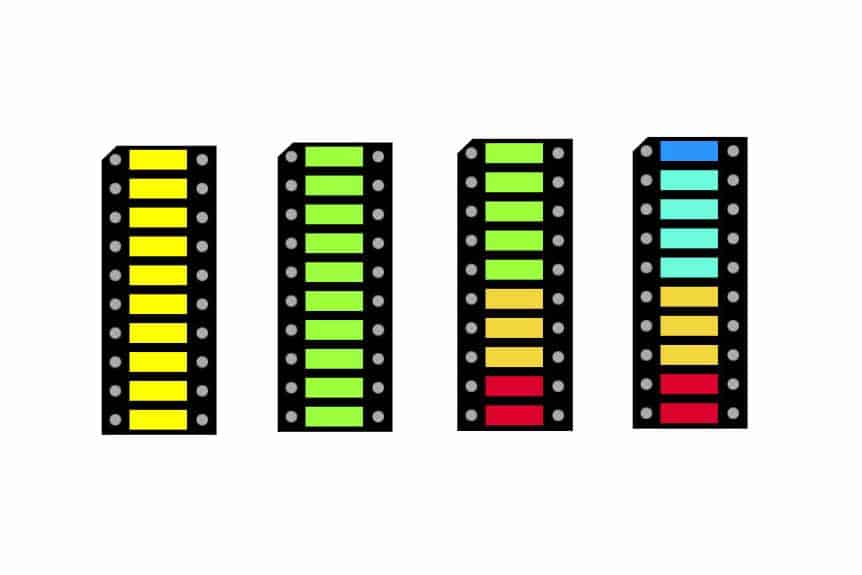
Some LED bar graphs will have only 2 LEDs, and some up to 14 LEDs in one case.
You can choose the right LED bar graph based on the size, power consumption, and amount of information you want to show.
Step-By-Step Instructions To Connect An LED Bar Graph To Arduino
Since there are so many variants, you have to adapt the connections slightly based on the number of pins available.
Let us start with a commonly found LED bar graph with 8 LEDs.
How To Connect An LED Bar Graph To An Arduino?
This section will provide a step-by-step guide to completing the necessary connections between Arduino and the LED bar graph.
The final connection looks like the image below.

Step 1: Start with LED1
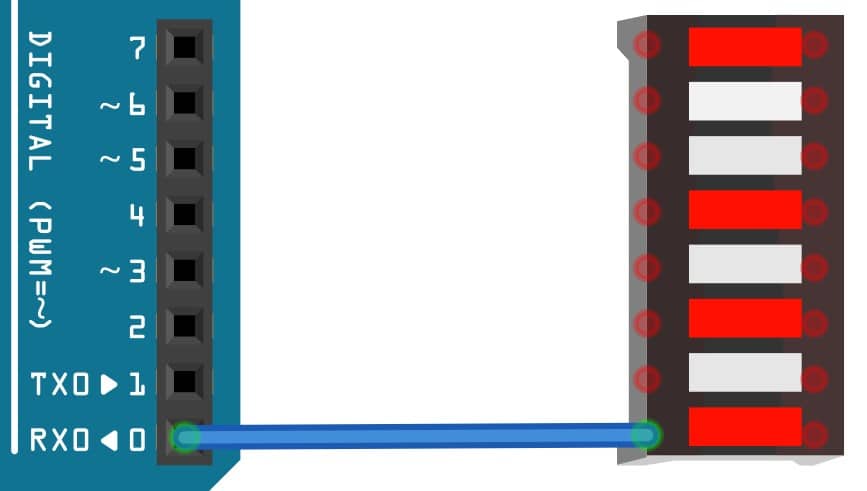
Connect the Anode of the LED1 in the bar graph to Pin 0 of the Arduino UNO.
Step 2: Connect the remaining seven pins
Connect the Arduino pins 1 to 7 to the remaining 7 LED bar graphs, as shown in the image below.
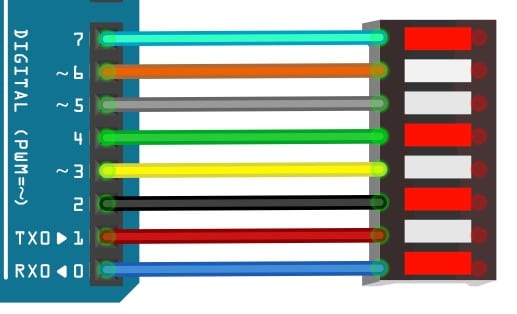
You can easily use them for loops and other logic if you connect them to the sequential Arduino pins, as in the above figure.
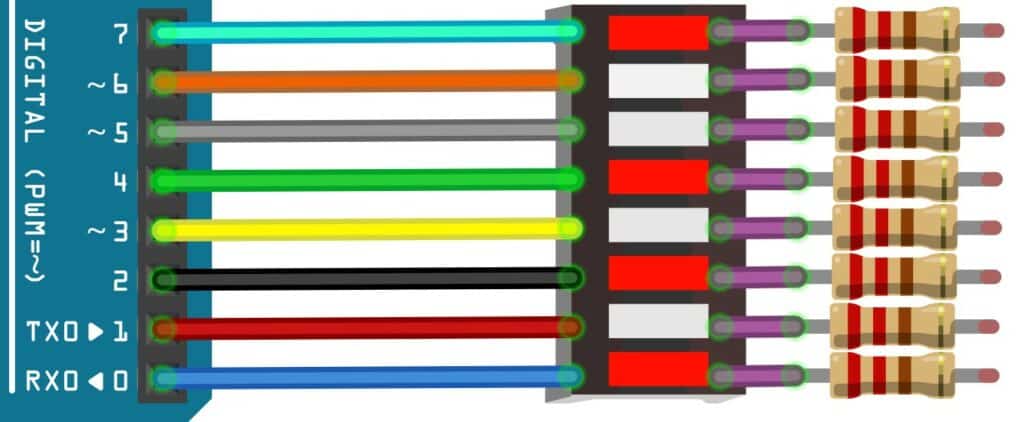
Step 3: Connect the current limiting resistors
Connect 220 ohms resistors in series for each of the LEDs. You protect the LEDs from burning out by limiting the current flowing through them.
Any resistor between 220 ohms and 470 ohms should be a good value.
Step 4: Connect the GND pin
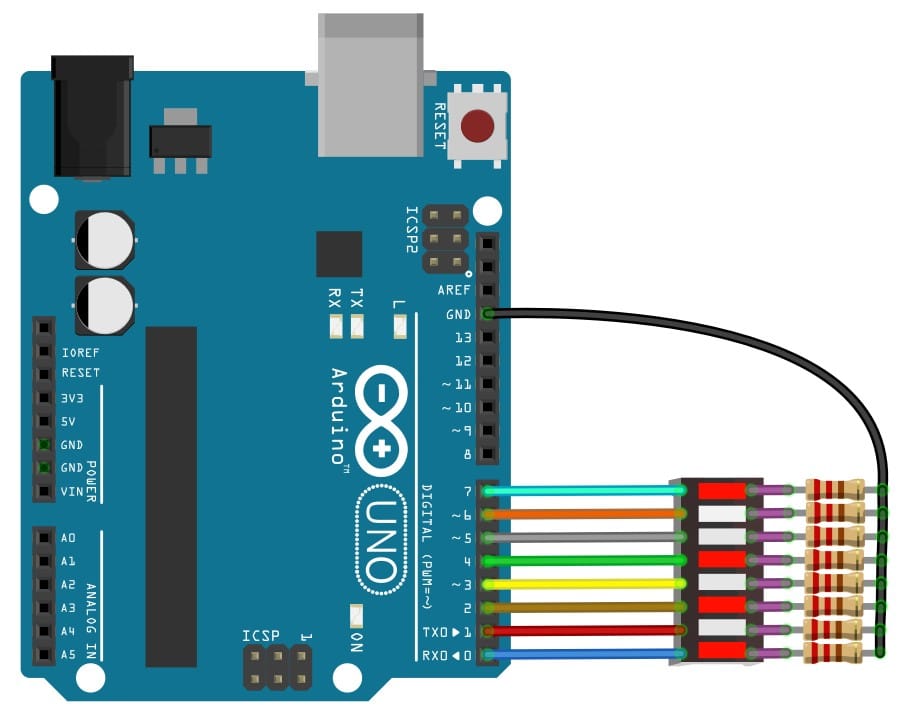
Congrats! You have completed all the required connections between the Arduino and the LED bar graph.
LED Bar Graph And Arduino Code Examples
In this section, you will find Arduino code to drive an LED bar graph with 8 LEDs. Let us get started.
Project 1: Arduino and LED Bar Graph Example
The following code helps you to verify the connections you have made. The code turns the LEDs on and off sequentially. Change the delay value to suit your preference.
const int ledCount = 8;    // the number of LEDs in the bar graph

int ledPins[] = {
  0, 1, 2, 3, 4, 5, 6, 7
};   // an array of pin numbers to which LEDs are attached

void setup() {
  // loop over the pin array and set them all to output:
  for (int thisLed = 0; thisLed < ledCount; thisLed++) {
    pinMode(ledPins[thisLed], OUTPUT);
  }
}

void loop() {
  // loop over the LED array:
  for (int thisLed = 0; thisLed < ledCount; thisLed++) {
    digitalWrite(ledPins[thisLed], HIGH);
    // wait for 200 ms before you turn off the LED
    delay(200);
    digitalWrite(ledPins[thisLed], LOW);

  }
}
If you have difficulties understanding how the code and electronics to control an LED works, have a look at our tutorial on How To Blink An LED Using Arduino (4 Different Ways).
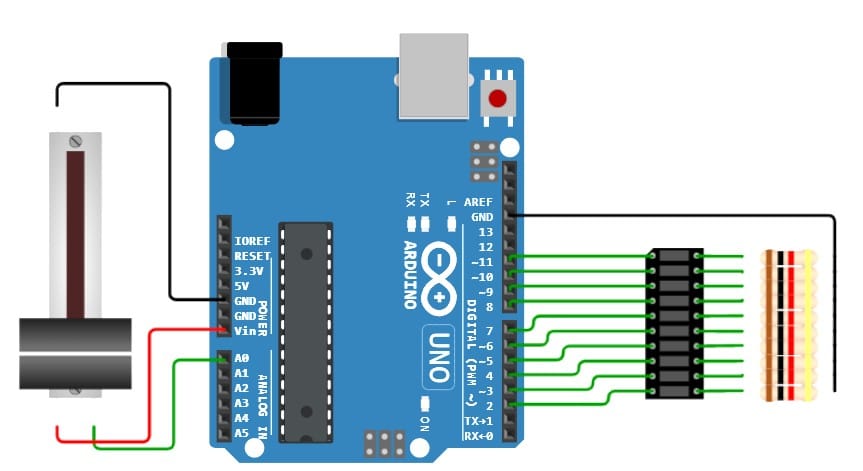
Project 2: Arduino, Potentiometer and LED Bar Graph Example
The following code drives the LED bar graph proportional to the analog value read from the potentiometer.
The Potentiometer is connected to Pin A0 of the Arduino. Remap, if necessary, to other available analog input pins. The same code works for any other analog sensors you plan to use.
The remap function can be modified so that you map the sensor range to cover all the LEDs on your LED bar graph.
The connection diagram from the analog value LED bar graph is shown below.
The Arduino code is straightforward to interpret. I recommend you tinker with the code and see the results for yourself.
Copy the following code into a new sketch.
const int analogPin = A0;   // the pin that the potentiometer is attached to
const int ledCount = 10;    // the number of LEDs in the bar graph

int ledPins[] = {
  2, 3, 4, 5, 6, 7, 8, 9, 10, 11
};   // an array of pin numbers to which LEDs are attached


void setup() {
  // loop over the pin array and set them all to output:
  for (int thisLed = 0; thisLed < ledCount; thisLed++) {
    pinMode(ledPins[thisLed], OUTPUT);
  }
}

void loop() {
  // read the potentiometer:
  int sensorReading = analogRead(analogPin);
  // map the result to a range from 0 to the number of LEDs:
  int ledLevel = map(sensorReading, 0, 1023, 0, ledCount);

  // loop over the LED array:
  for (int thisLed = 0; thisLed < ledCount; thisLed++) {
    // if the array element's index is less than ledLevel,
    // turn the pin for this element on:
    if (thisLed < ledLevel) {
      digitalWrite(ledPins[thisLed], HIGH);
    }
    // turn off all pins higher than the ledLevel:
    else {
      digitalWrite(ledPins[thisLed], LOW);
    }
  }
}
For more information about potentiometers and how to use them to control LEDs have a look at the tutorial on How use Arduino to control an LED with a Potentiometer.
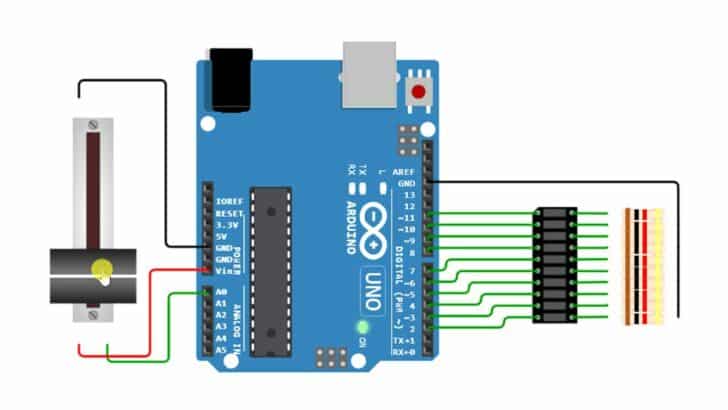
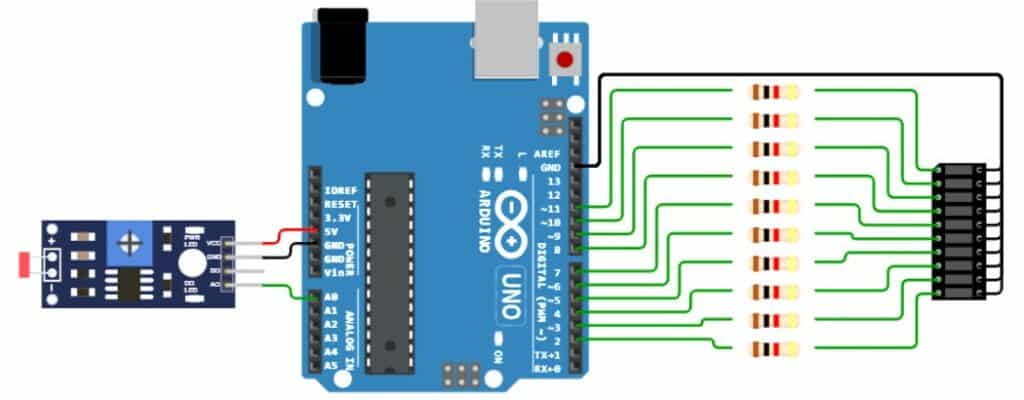
Project 3: LED Bar Graph and Light Sensor Arduino Code
The project below drives the LED bar graph proportional to the amount of light incident on the photo sensor. Below is the connection diagram.
When the light intensity is less, the LED bar graph remains off. If the light intensity increases, the LEDs in the LED bar graph glow one by one.
You can edit the code and make it more interesting. If you have any questions, post them in the comments section.
The Arduino code for the project above is as follows.
// These constants should match the photoresistor's "gamma" and "rl10" attributes
const int sensorPin = A0; // Set pin of the Photoresistor sensor
const float GAMMA = 0.7;
const float RL10 = 50;
const int ledCount = 10;  // Set number of LEDs in the bar graph

// Array of pins for LEDs in the bar graph
int ledPins[] = {
  2, 3, 4, 5, 6, 7, 8, 9, 10, 11
};

void setup() {
  // Loop over the LEDs pins and set all to output
  for (int thisLed = 0; thisLed < ledCount; thisLed++) {
    pinMode(ledPins[thisLed], OUTPUT);
  }
}

void loop() {
  // Read the Photoresistor sensor value
  int sensorReading = analogRead(sensorPin);

  // Convert the analog value into lux value
  float voltage = sensorReading / 1024. * 5;
  float resistance = 2000 * voltage / (1 - voltage / 5);
  float lux = pow(RL10 * 1e3 * pow(10, GAMMA) / resistance, (1 / GAMMA));

  // Map the result to a range from lux to the number of LEDs
  int ledLevel = map(lux, 0, 1023, 0, ledCount);

  // Loop over the LEDs pins and set element
  for (int thisLed = 0; thisLed < ledCount; thisLed++) {
    // If the array element's index is less than ledLevel
    if (thisLed < ledLevel) {
      // Turn the pin for this element on
      digitalWrite(ledPins[thisLed], HIGH);
    } else {
      // Turn off all pins higher than the ledLevel
      digitalWrite(ledPins[thisLed], LOW);
    }
  }
}
FAQs About The Arduino And LED Bar Graph Projects
In this section, you will get answers to the most frequent questions on LED bars and Arduino projects. I have compiled the questions in one place.
I will be happy to grow the list if you have further questions which are still not answered.
Please post all your questions in the comment section.
1) How do you connect the LED bar to Arduino?
You can connect simple LED bars directly to the Arduino GPIO pins. The GPIO pins can be in any order.
Connecting the Pins sequentially helps to some extent while you code Arduino to create patterns on the LED bar.
The LED bar modules come with both an LED bar and a chip that accepts the data serially and, in turn, drives the LED bar.
In that case, you need two GPIOs configured to act as Serial clocks and Serial data.
2) What is an LED Bar graph?
An LED Bar graph is a series of LEDs connected in a row in a housing.
3) What are the applications of LED bar graphs?
I have listed a few example projects here where you will find applications for LED bars. The LED bar graphs are an excellent addition to the projects.
They are used in a variety of applications.
Analog sensor output: LED bars are an excellent choice to showcase the analog work of the sensors in a pleasing eyes manner. For example, assume you have a liquid flow sensor that gives you analog voltage (equivalent to the flow rate).
You can read the analog voltage and remap the value onto the 8 of 16 LED graph.
Potentiometer position display: You can use LED bars to show the volume level or the position of the potentiometer. The LED bar gives better feedback on the position to the end user.
4) Do you need a current limiting resistor for LED Bars?
The LEDs need a current-limiting resistor. The LED bar modules may come with current limiting resistors too. Hence, I recommend constantly checking the datasheet of the LED bar module.
Suppose you don’t have any technical documents on the LED bar.
Better to use the current limiting resistors in the initial stage.
Conclusion
I hope this article gave you everything you need to know about LED bars so that you can plan to use them in your upcoming display projects.
I have used LED bars in two projects: an Air Quality indicator and an RF signal power indicator. It was fun to work with them. You can also cascade them to create cool display projects.
Kindly let us know if you have any feedback on improving the article or presentation style. Your suggestions help in creating more helpful content for our readers.
Which project would you love to read about next? Are there any topics you would like us to write about?
Let us know in the comments section.
If you have found this LED bar graph article helpful, please share it with your friends and Arduino enthusiasts!

I am Puneeth. I love tinkering with open-source projects, Arduino, ESP32, Pi and more. I have worked with many different Arduino boards and currently I am exploring, Arduino powered LoRa, Power line communication and IoT.